Main deck 72 cards (27 distinct)
1
Mordenkainen
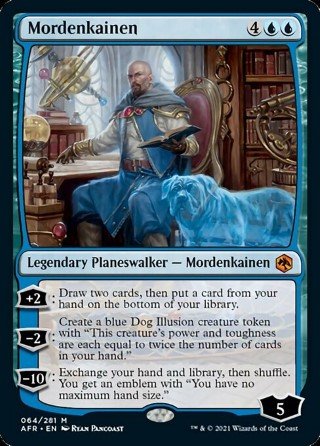
1
Black Dragon
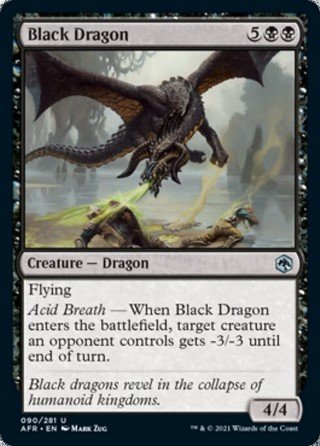
2
Vampire Spawn
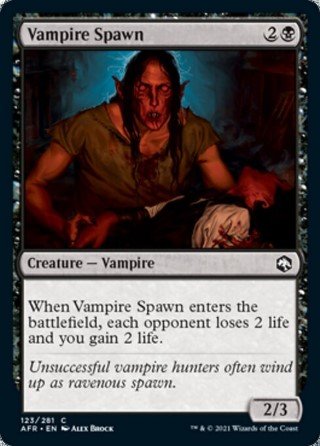
1
Gelatinous Cube
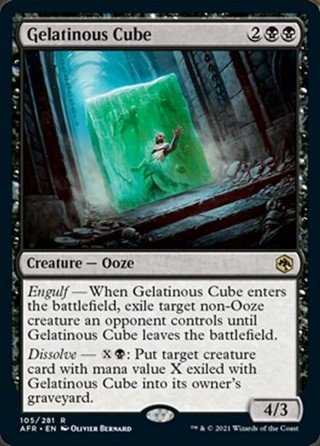
3
Mind Flayer
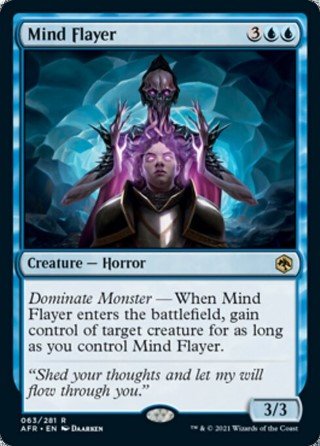
1
Blue Dragon
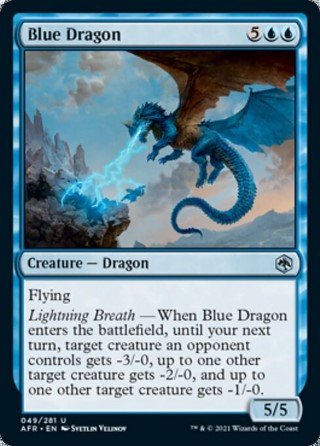
1
Iymrith, Desert Doom
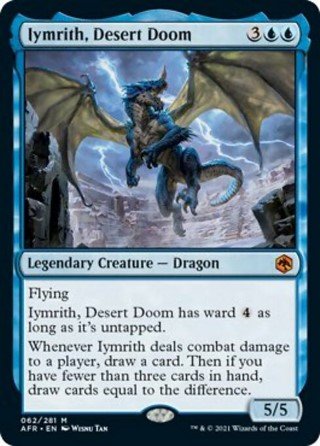
4
Ruin Crab
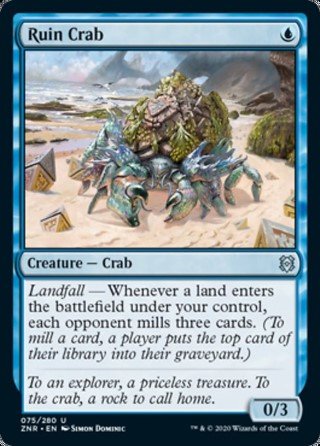
1
Kotose, the Silent Spider
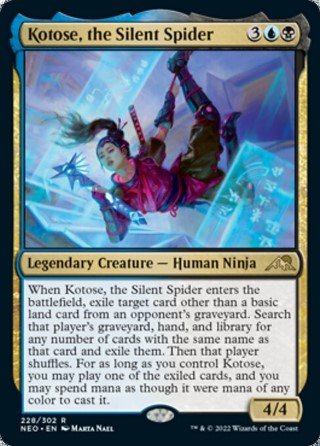
1
Shadow of Mortality
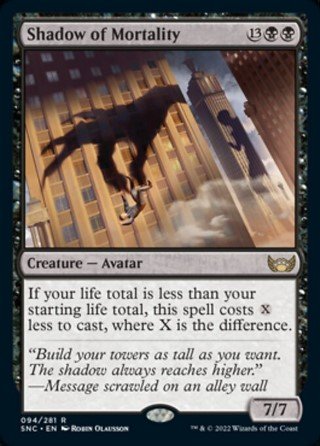
4
Merfolk Windrobber
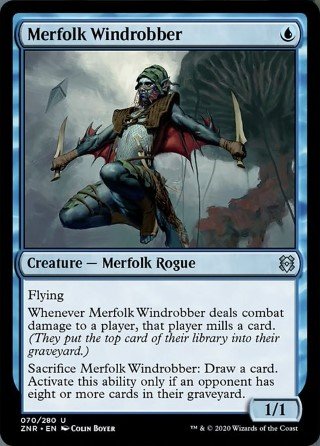
1
Aberrant Mind Sorcerer
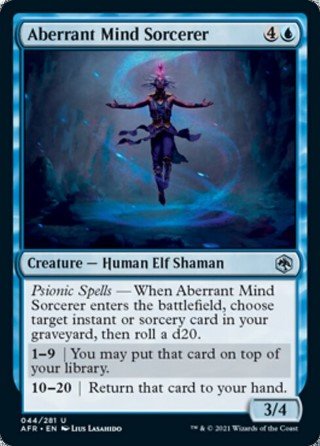
1
Multiple Choice
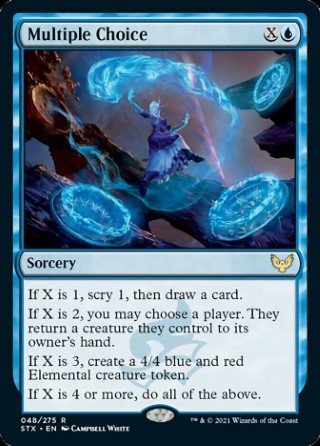
4
Flunk
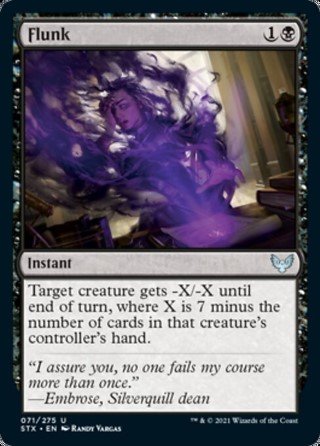
3
Poison the Cup
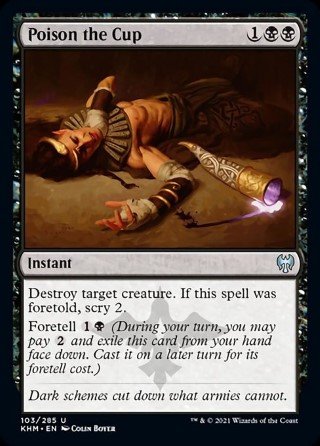
2
Skull Raid
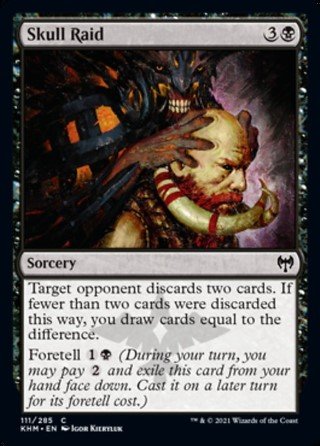
3
Treasure Chest
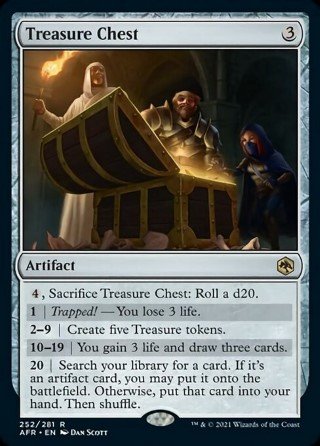
2
The Meathook Massacre
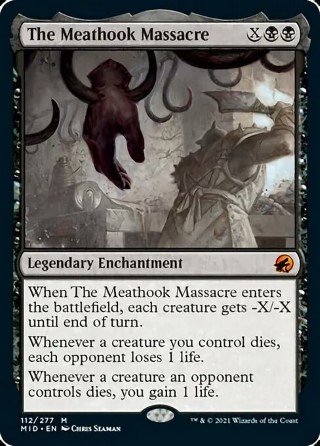
4
Maddening Cacophony
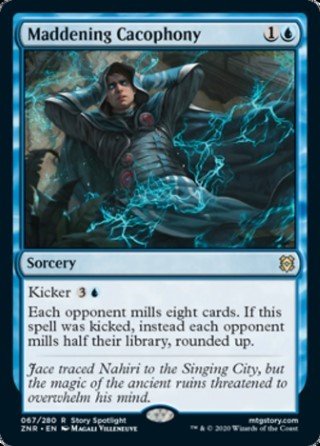
2
Bubble Snare
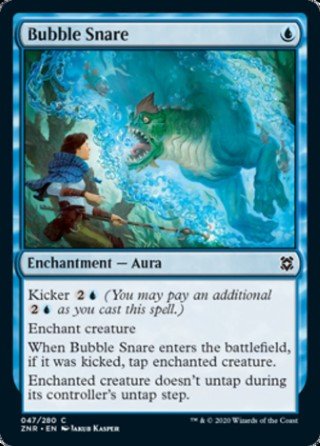
2
Anticognition
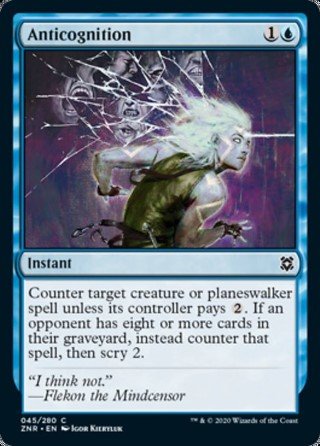
2
Tasha's Hideous Laughter
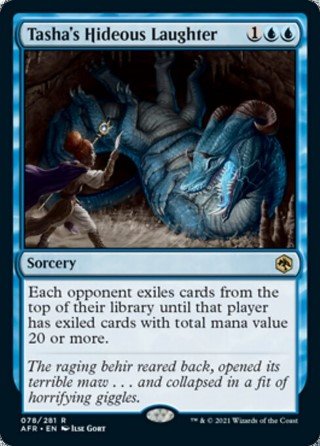
1
Lash of Malice
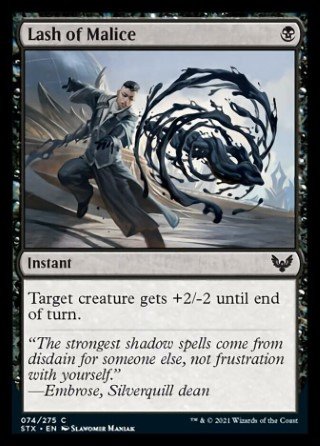
1
Clearwater Pathway
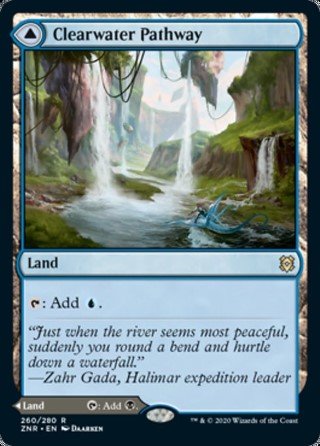
10
Island
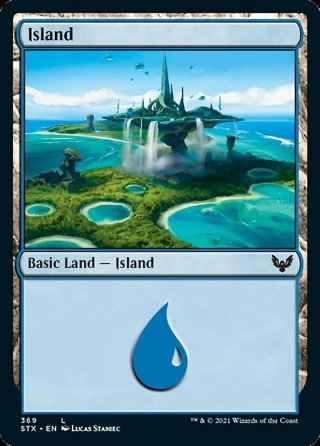
10
Swamp
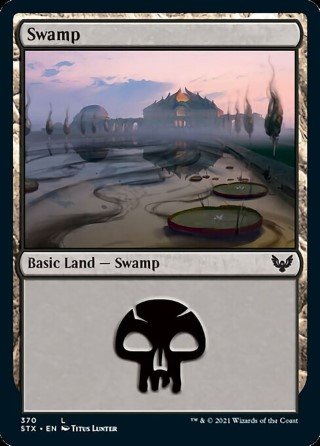
4
Shipwreck Marsh
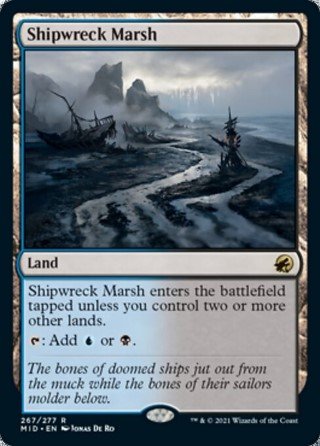
Mana Curve
Color Breakdown
| Ranked | W-L | Winrate |
|---|---|---|
|
|
||
| Total | 12 - 11 | 52.2% |
| 1 - 0 | 100.0% | |
| 1 - 0 | 100.0% | |
| 1 - 0 | 100.0% | |
| 1 - 0 | 100.0% | |
| 1 - 0 | 100.0% | |
| 1 - 0 | 100.0% | |
| 1 - 0 | 100.0% | |
| 1 - 0 | 100.0% | |
| 1 - 0 | 100.0% | |
| 1 - 0 | 100.0% | |
| 1 - 0 | 100.0% | |
| 1 - 0 | 100.0% | |
| 0 - 1 | 0.0% | |
| 0 - 1 | 0.0% | |
| 0 - 1 | 0.0% | |
| 0 - 1 | 0.0% | |
| 0 - 1 | 0.0% | |
| 0 - 1 | 0.0% | |
| 0 - 1 | 0.0% | |
| 0 - 1 | 0.0% | |
| 0 - 1 | 0.0% | |
| 0 - 1 | 0.0% | |
| 0 - 1 | 0.0% | |
| Play | W-L | Winrate |
|---|---|---|
|
|
||
| Total | 9 - 10 | 47.4% |
| 1 - 0 | 100.0% | |
| 1 - 0 | 100.0% | |
| 1 - 0 | 100.0% | |
| 1 - 0 | 100.0% | |
| 1 - 0 | 100.0% | |
| 1 - 0 | 100.0% | |
| 1 - 0 | 100.0% | |
| 1 - 0 | 100.0% | |
| 1 - 0 | 100.0% | |
| 0 - 1 | 0.0% | |
| 0 - 1 | 0.0% | |
| 0 - 1 | 0.0% | |
| 0 - 1 | 0.0% | |
| 0 - 1 | 0.0% | |
| 0 - 1 | 0.0% | |
| 0 - 1 | 0.0% | |
| 0 - 1 | 0.0% | |
| 0 - 1 | 0.0% | |
| 0 - 1 | 0.0% | |
| Event | W-L | Winrate |
|---|---|---|
|
|
||
| Total | 1 - 0 | 100.0% |
| 1 - 0 | 100.0% | |